3 Simulation data visualisation
The previous section (Section 2) showed how the data is simulated. Another important aspect is visualising the data, and DAISIEmainland has a selection of plotting functions to plot the phylogenetic data of the mainland and the island.
3.1 Visualise mainland
We simulate the same mainland system as Section 2.1 and then plot the all the mainland clades using plot_mainland.
set.seed(
  1,
  kind = "Mersenne-Twister",
  normal.kind = "Inversion",
  sample.kind = "Rejection"
)
mainland <- DAISIEmainland:::sim_mainland(
  total_time = 1,
  m = 5,
  mainland_ex = 1
)
DAISIEmainland::plot_mainland(mainland)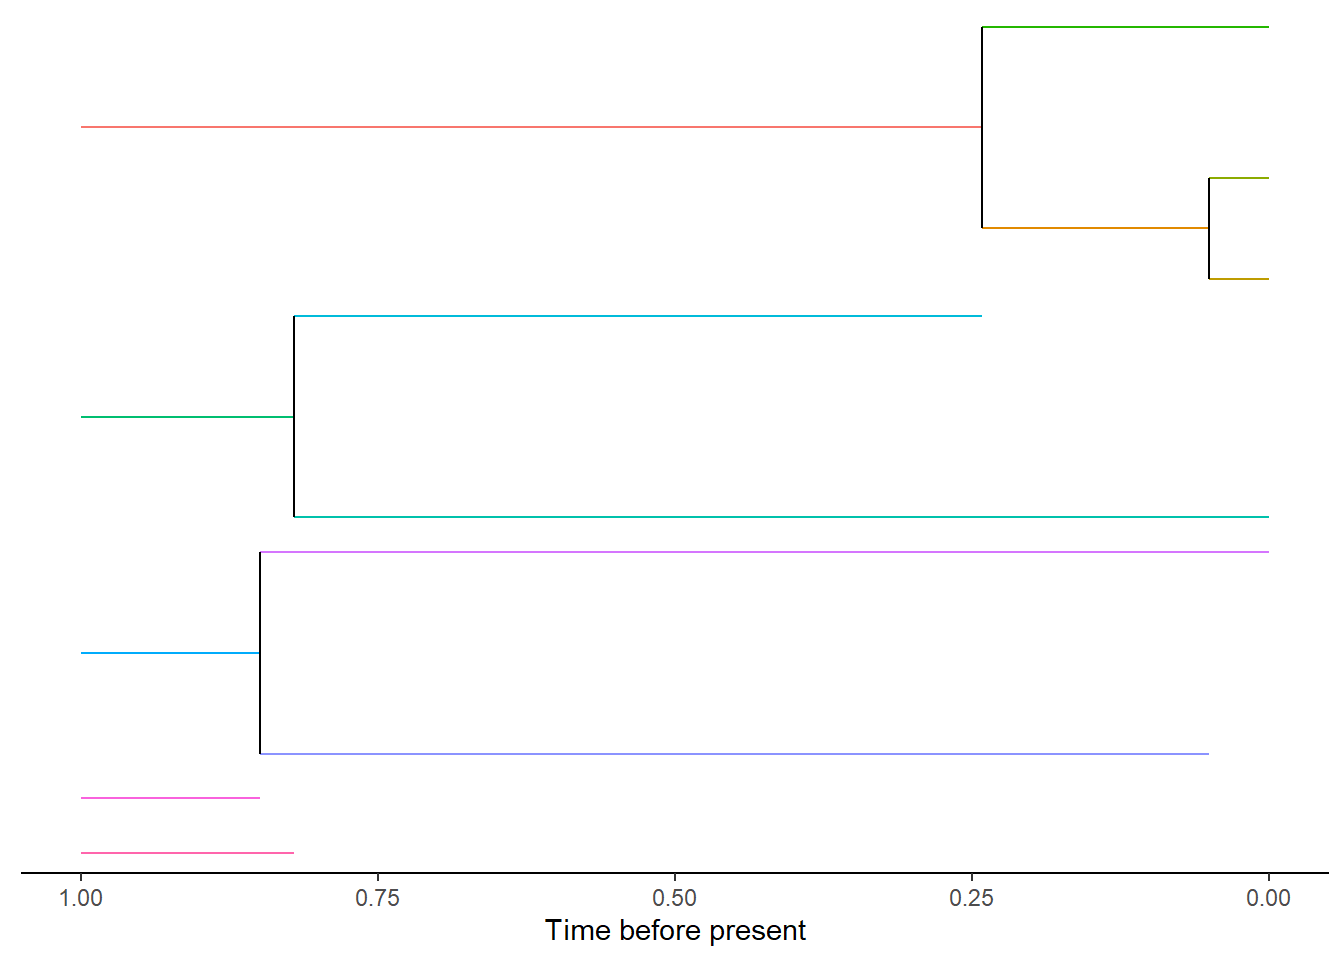
The above plot shows the evolutionary history of each mainland species from the start of the simulation, as five independent (i.e. no phylogenetic relatedness) mainland species, to five extant species at the present. Each species is given as unique species ID which are shown here as different coloured branches. The colours can also be changed to represent the clade a species belongs to.
DAISIEmainland::plot_mainland(mainland, branch_colour = "clade_id")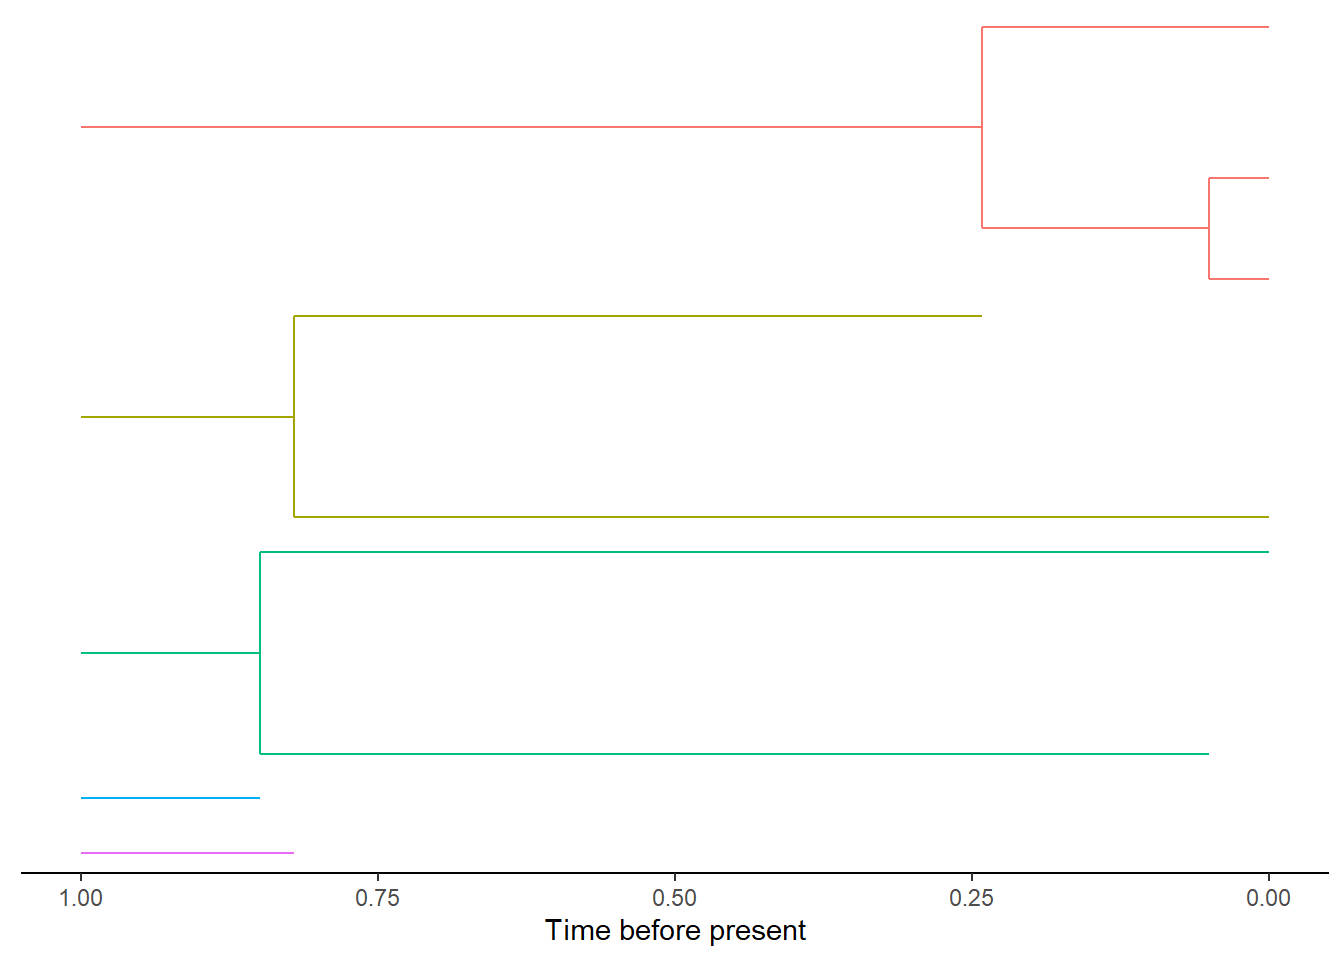
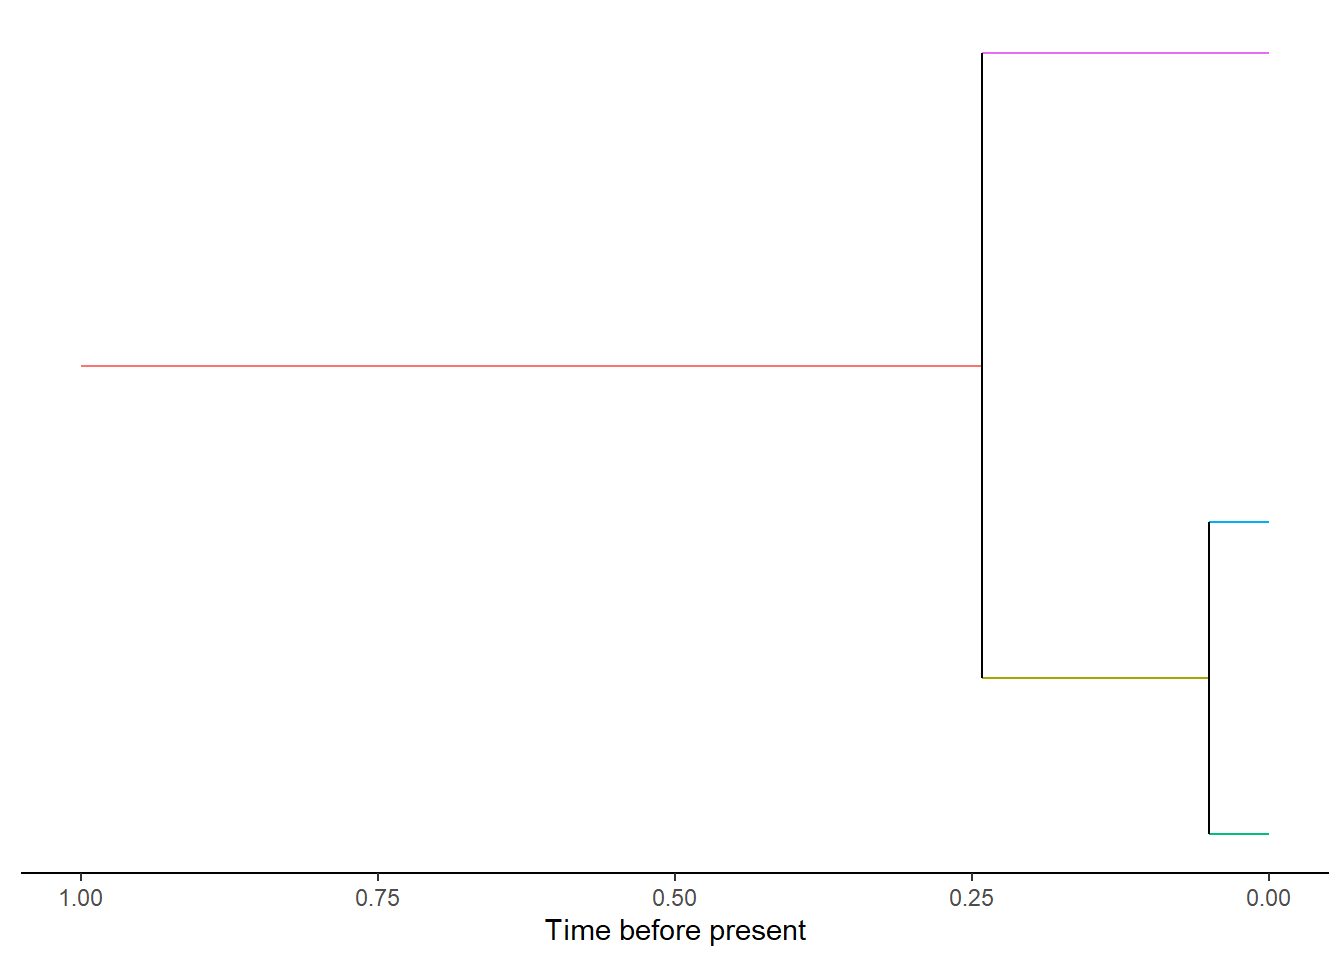
If there are many clades on the mainland it can be difficult to see when plotted
as an entire community. Instead individual mainland clades can be selected from
the data and plotted with plot_mainland_clade. Again the option of plotting
the unique species ID or clade ID are available.
DAISIEmainland::plot_mainland_clade(
  mainland_clade = mainland[[1]],
  branch_colour = "unique_species_id"
)
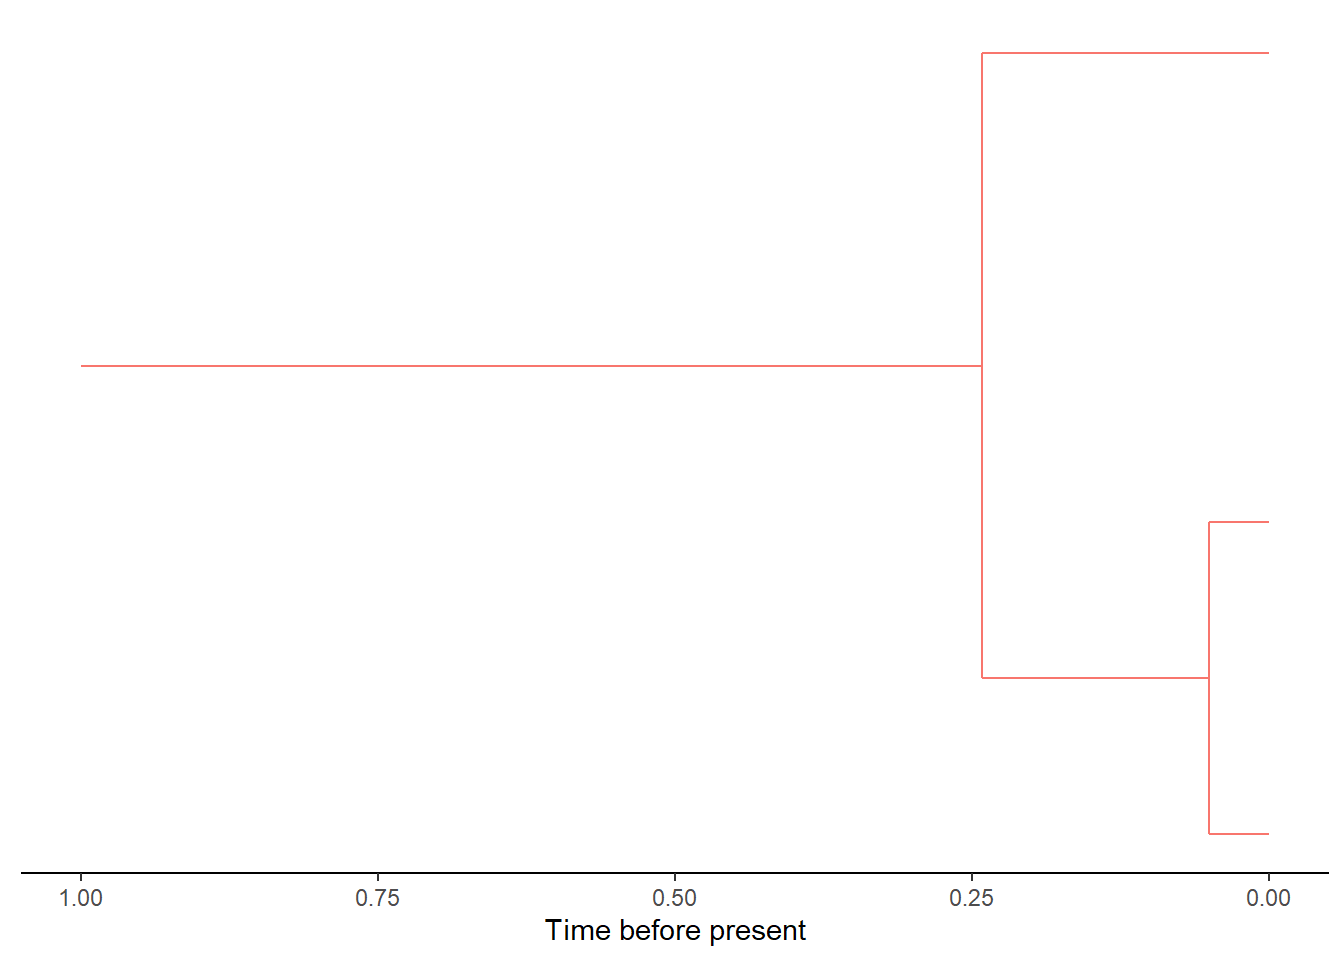
DAISIEmainland::plot_mainland_clade(
  mainland_clade = mainland[[1]],
  branch_colour = "clade_id"
)
3.2 Visualise island
The same set of plotting functionality exists for the island data. Here we
simulate a range of possible outcomes for the island data and show how each
looks using the function plot_daisie_data.
- An empty island
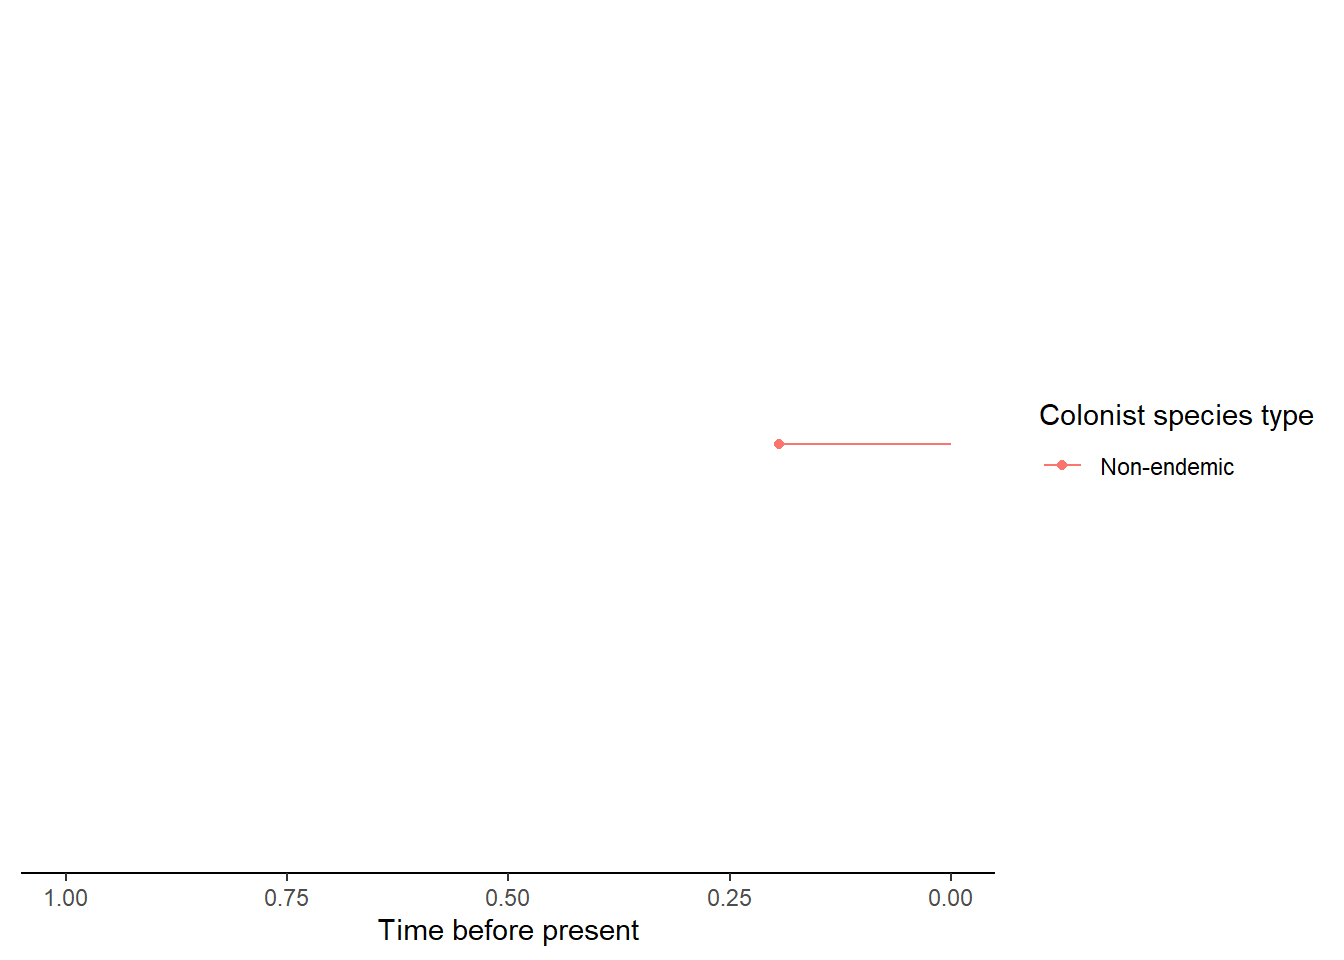
- An island with a single non-endemic species
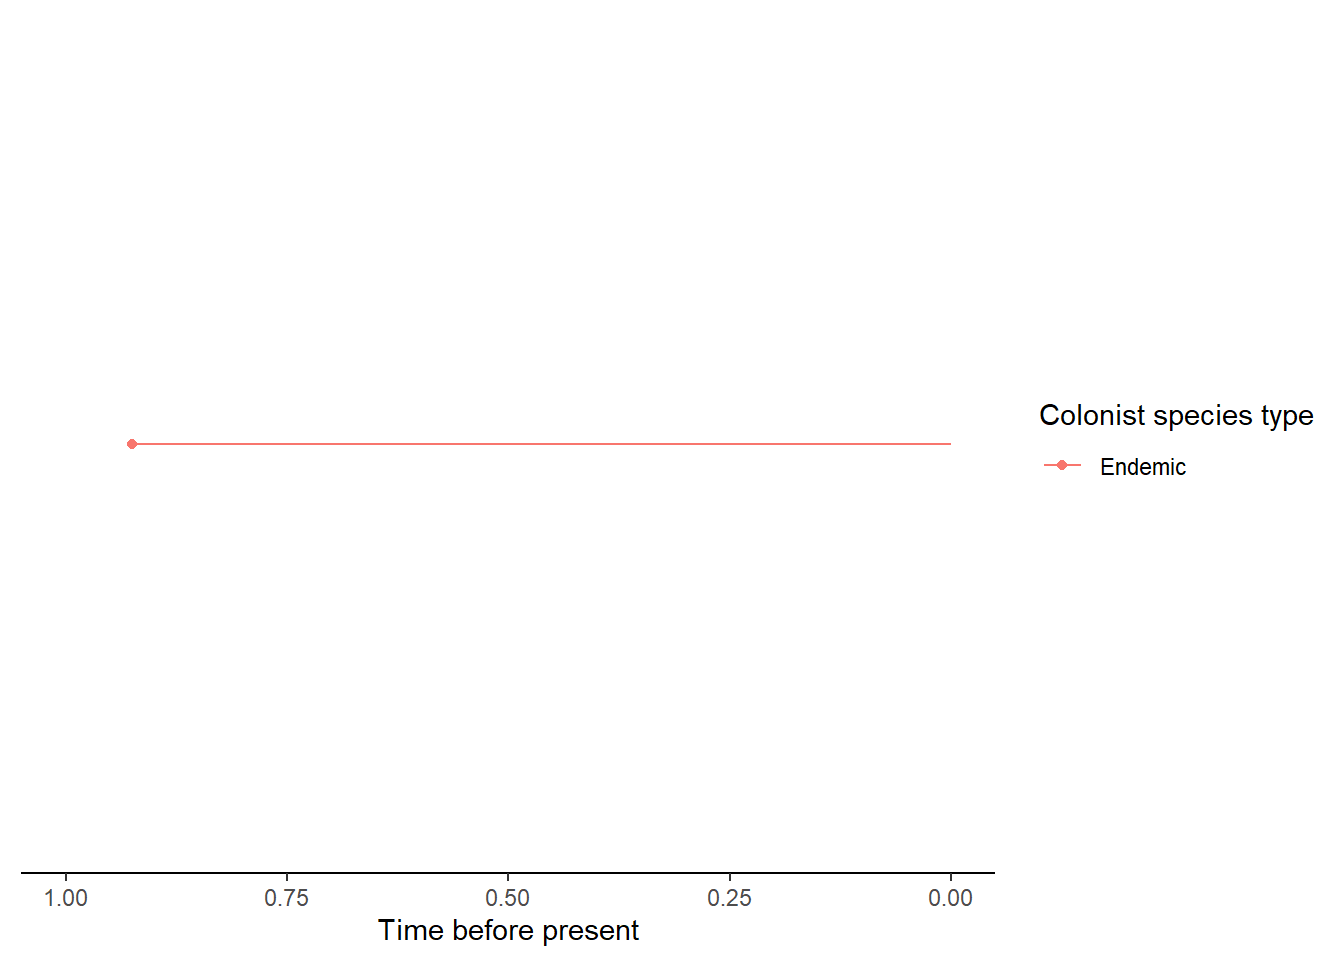
- An island with a single endemic species
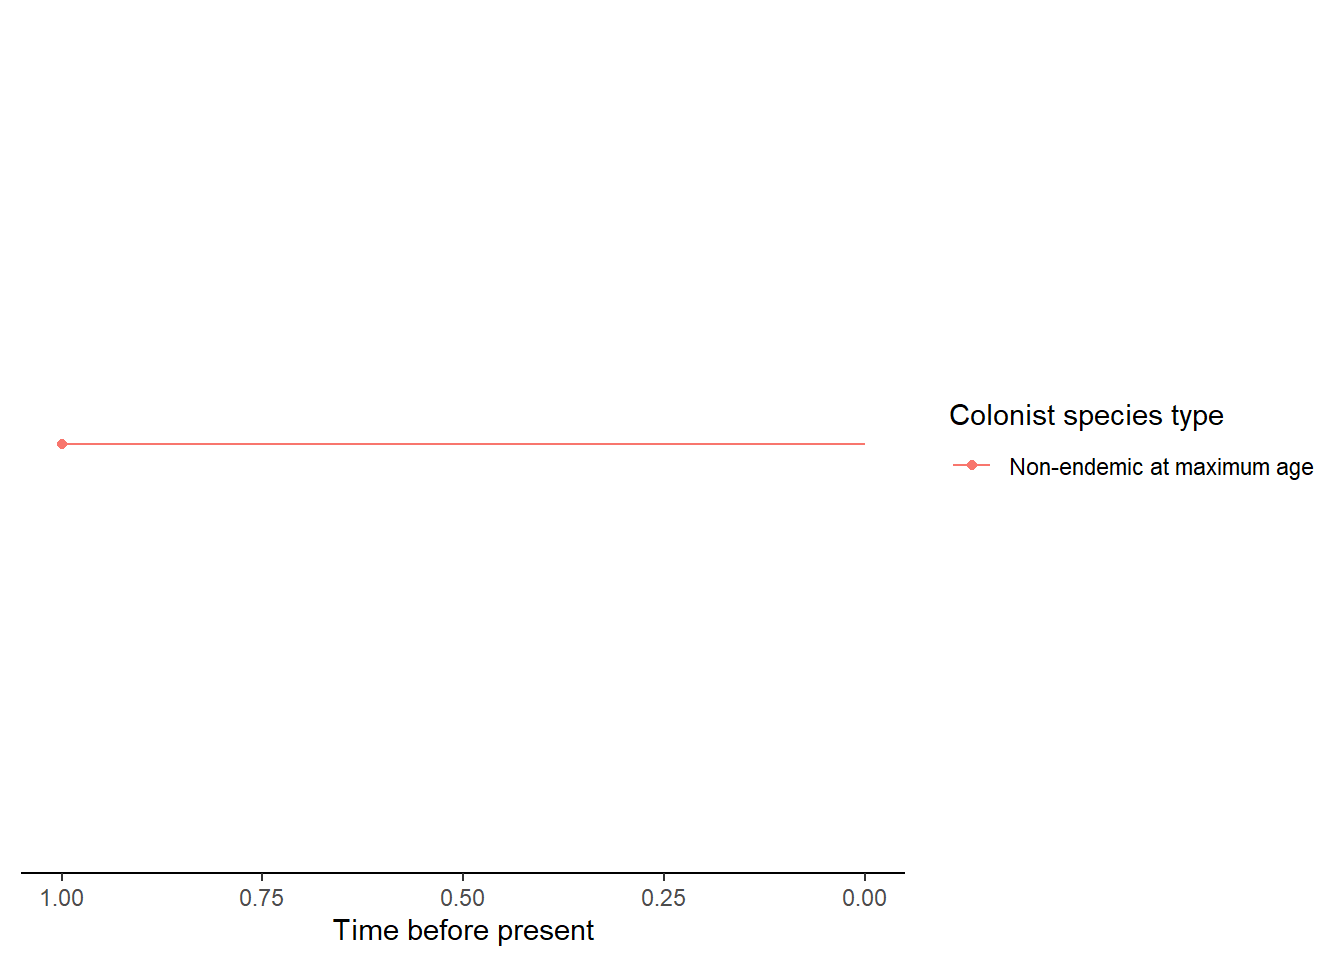
- An island with a single non-endemic species whose colonisation time
is older than the island age so it is considered an island-age or maximum-age
colonisation (i.e. it colonised at the island age because it could not have
colonised before). This uncertainty in the timing of colonisation is then taken
into account when the data is input into the
DAISIElikelihood model.
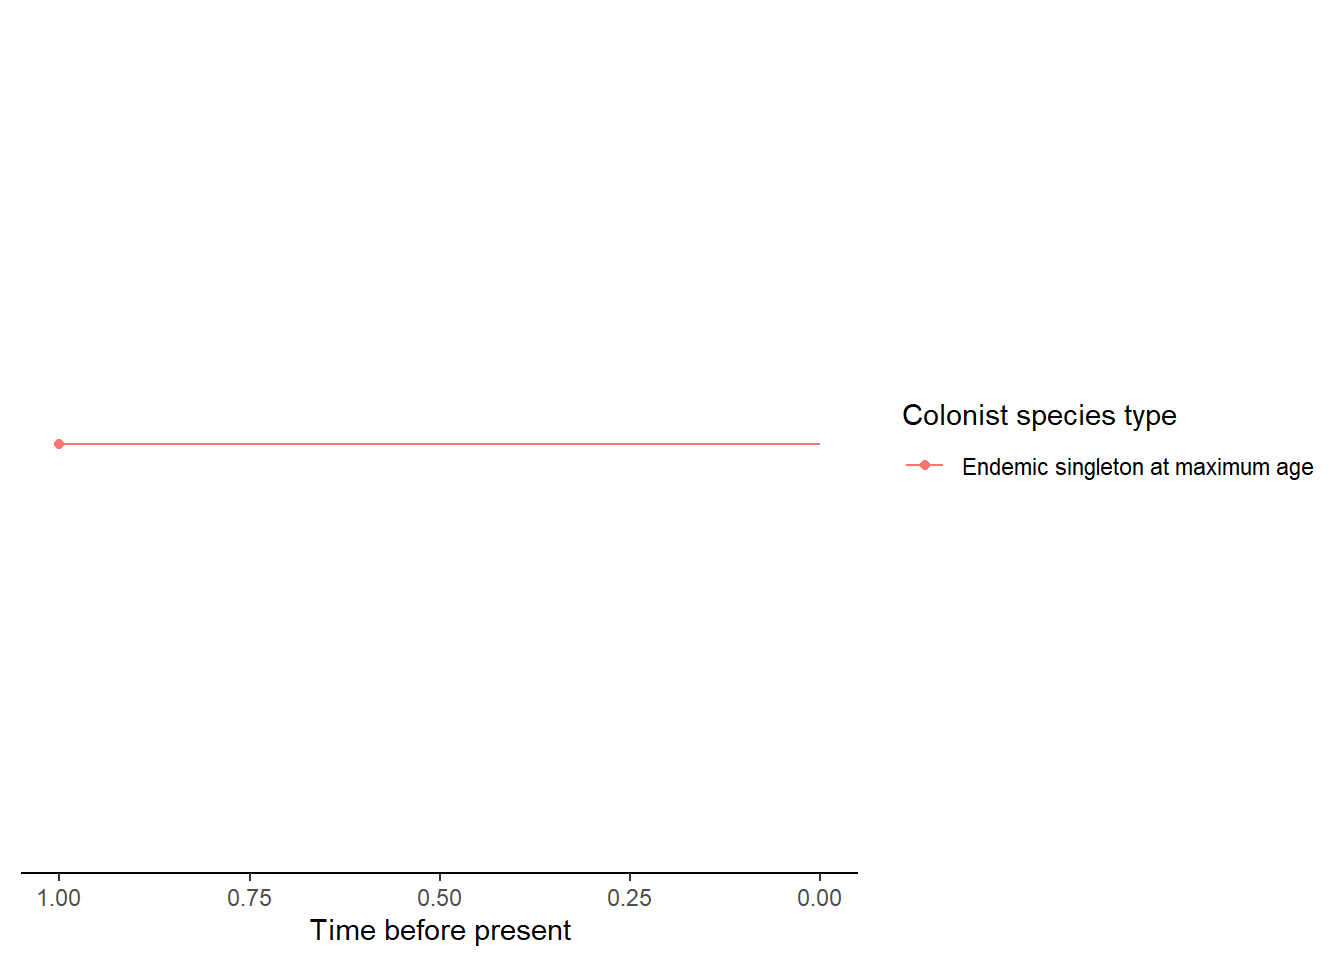
- An island with a single endemic species which whose colonisation time is older than the island age so it is considered an island-age colonisation. The uncertainty in colonisation time is handled in an equivalent way to the non-endemic island-age colonisation.
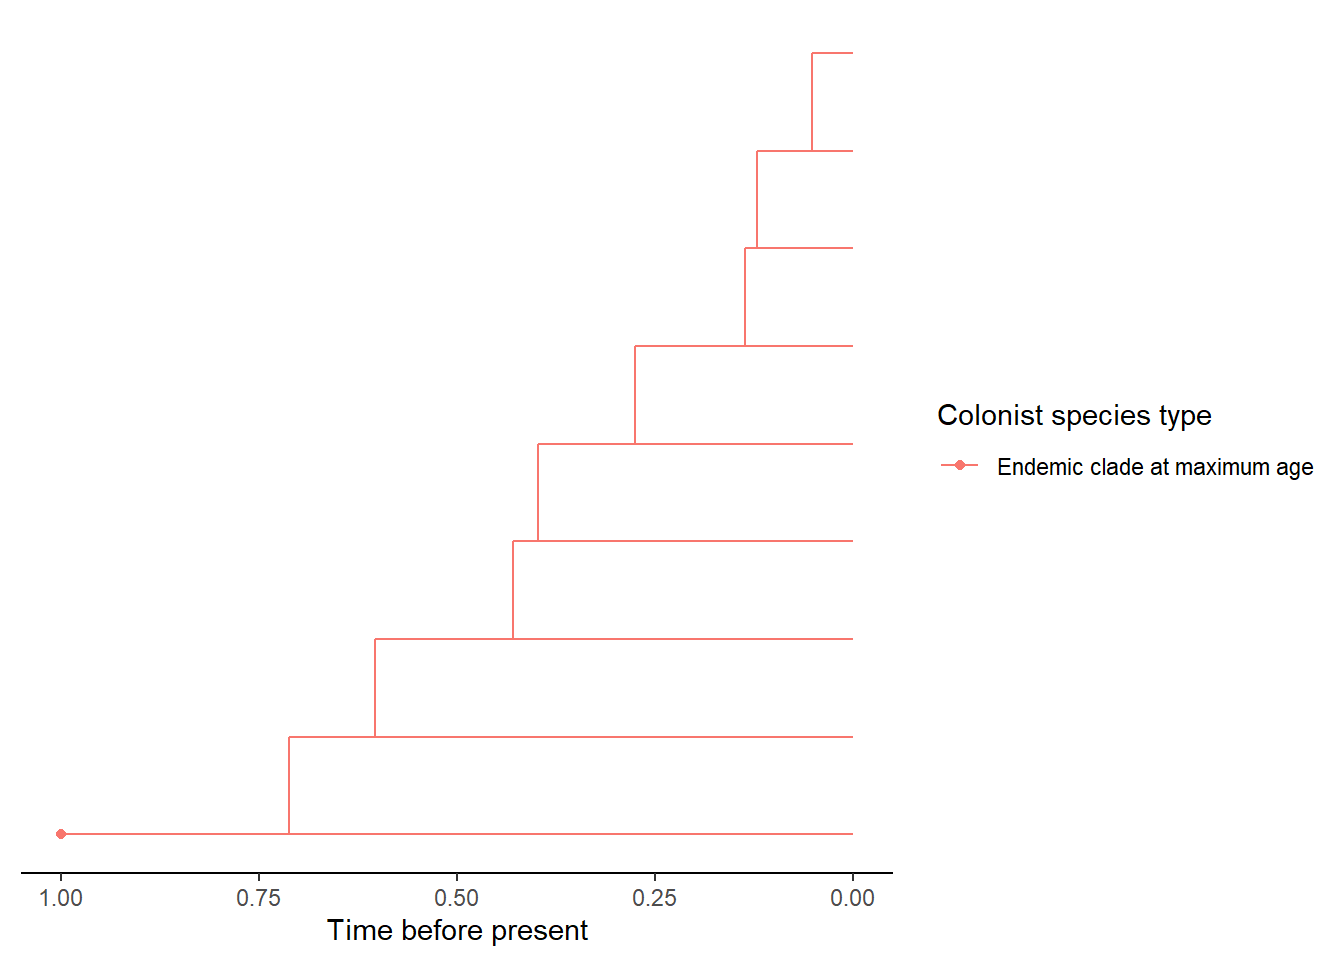
- An island with an endemic clade whose colonisation time
is older than the island age so it is considered an island-age colonisation.
In
DAISIEthe colonisation time is assumed to have occurred between the island age and the first branching time in the clade.
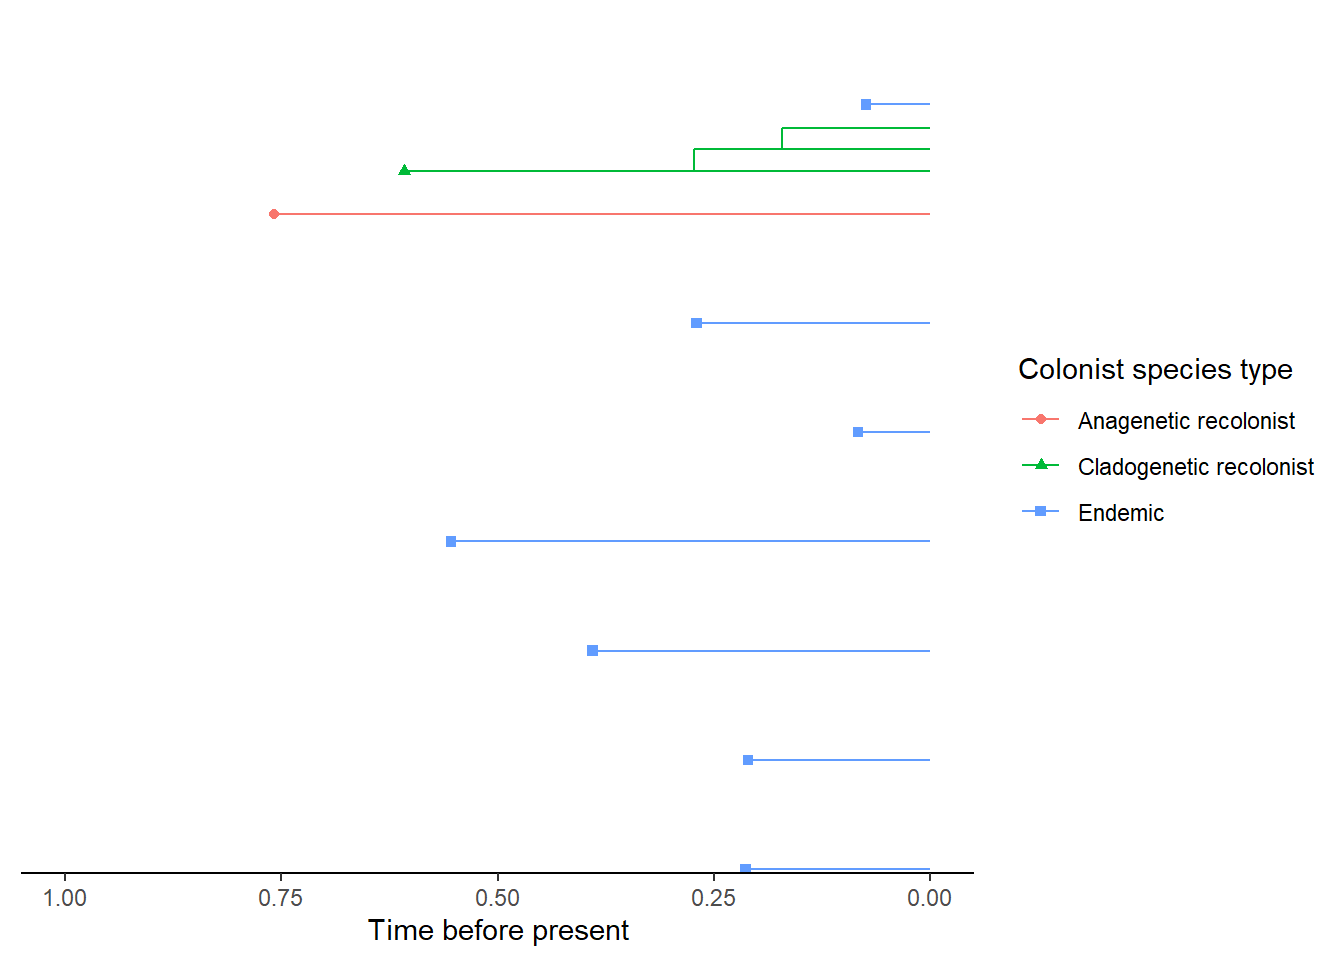
- An island with an recolonisation of the same mainland species after it has colonised and speciated (either via cladogenesis or anagenesis on the island). The colonists that are from the same ancestral mainland species but the island species is now endemic are show by ‘Colonist after anagenesis’ and ‘Colonist after cladogenesis.’
All the above scenarios are of one of the daisie_data sets that are produced
from the sim_island_with_mainland() function which produces the ideal_data
and empirical_data. plot_daisie_mainland_data plots these two island data
sets together.
#> $ideal_multi_daisie_data
#> $ideal_multi_daisie_data[[1]]
#> $ideal_multi_daisie_data[[1]][[1]]
#> $ideal_multi_daisie_data[[1]][[1]]$island_age
#> [1] 1
#>
#> $ideal_multi_daisie_data[[1]][[1]]$not_present
#> [1] 3
#>
#>
#> $ideal_multi_daisie_data[[1]][[2]]
#> $ideal_multi_daisie_data[[1]][[2]]$branching_times
#> [1] 1.0000000 0.1026008
#>
#> $ideal_multi_daisie_data[[1]][[2]]$stac
#> [1] 2
#>
#> $ideal_multi_daisie_data[[1]][[2]]$missing_species
#> [1] 0
#>
#>
#> $ideal_multi_daisie_data[[1]][[3]]
#> $ideal_multi_daisie_data[[1]][[3]]$branching_times
#> [1] 1.0000000 0.9627315
#>
#> $ideal_multi_daisie_data[[1]][[3]]$stac
#> [1] 2
#>
#> $ideal_multi_daisie_data[[1]][[3]]$missing_species
#> [1] 0
#>
#>
#>
#>
#> $empirical_multi_daisie_data
#> $empirical_multi_daisie_data[[1]]
#> $empirical_multi_daisie_data[[1]][[1]]
#> $empirical_multi_daisie_data[[1]][[1]]$island_age
#> [1] 1
#>
#> $empirical_multi_daisie_data[[1]][[1]]$not_present
#> [1] 3
#>
#>
#> $empirical_multi_daisie_data[[1]][[2]]
#> $empirical_multi_daisie_data[[1]][[2]]$branching_times
#> [1] 1.0000000 0.8489636
#>
#> $empirical_multi_daisie_data[[1]][[2]]$stac
#> [1] 2
#>
#> $empirical_multi_daisie_data[[1]][[2]]$missing_species
#> [1] 0
#>
#>
#> $empirical_multi_daisie_data[[1]][[3]]
#> $empirical_multi_daisie_data[[1]][[3]]$branching_times
#> [1] 1.00000 0.99999
#>
#> $empirical_multi_daisie_data[[1]][[3]]$stac
#> [1] 5
#>
#> $empirical_multi_daisie_data[[1]][[3]]$missing_species
#> [1] 0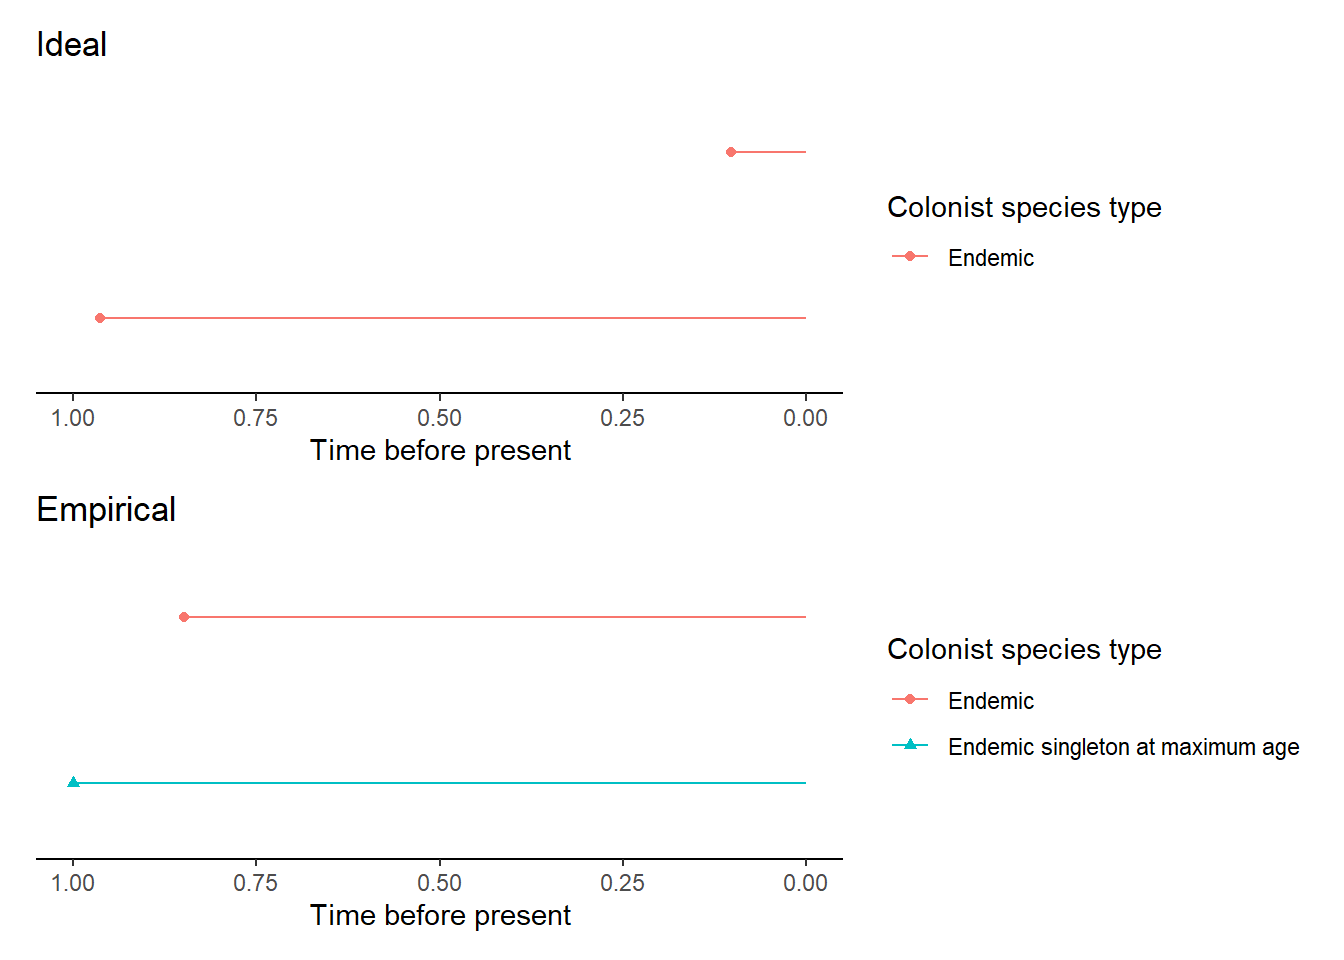
In the plot juxtaposing the ideal_data (top) and the empirical_data (bottom)
it is clear that the colonisation times differ for one of the island colonists.
In the empirical_data this colonist is an island-age colonist which is likely
due to the effects of mainland dynamics shifting the empiricist’s perception of
the colonisation time.