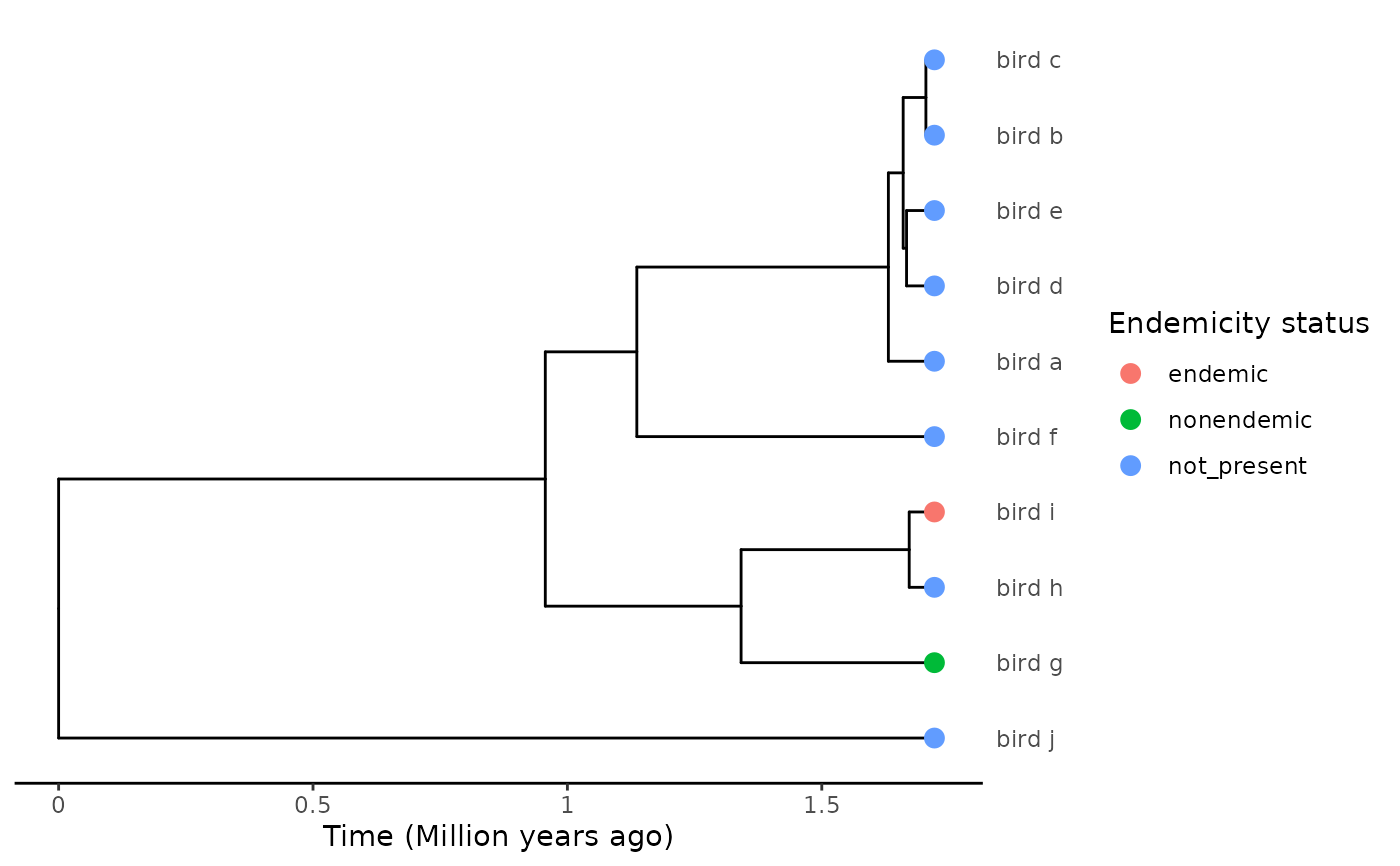
Plots the phylogenetic tree and its associated tip and/or node data
Source:R/plot_phylod.R
plot_phylod.RdPlots the phylogenetic tree and its associated tip and/or node data
Examples
set.seed(
  1,
  kind = "Mersenne-Twister",
  normal.kind = "Inversion",
  sample.kind = "Rejection"
)
phylo <- ape::rcoal(10)
phylo$tip.label <- c("bird_a", "bird_b", "bird_c", "bird_d", "bird_e",
                     "bird_f", "bird_g", "bird_h", "bird_i", "bird_j")
phylo <- phylobase::phylo4(phylo)
endemicity_status <- sample(
  c("not_present", "endemic", "nonendemic"),
  size = length(phylobase::tipLabels(phylo)),
  replace = TRUE,
  prob = c(0.6, 0.2, 0.2)
)
phylod <- phylobase::phylo4d(phylo, as.data.frame(endemicity_status))
plot_phylod(phylod)
