epipipe Guide
epipipe.Rmdepipipe is an R package containing vignettes that explain individual tasks for epidemiological analysis and building custom pipelines. The vignettes are designed to be used together by copying and pasting code into an R script to ensure that units of epidemiological data wrangling or analysis are interoperable. epipipe achieves this by providing “glue” code to ensure that packages or functions work together seamlessly.
If you are new to R we recommend The Epidemiologist R Handbook chapter on R basics as well as the R for Data Science book.
epipipe currently contains six vignettes. Three explain how to import linelist data into R. One explains how to clean and aggregate linelist. Two explain how to estimate disease transmissibility. The code from each vignette can be copy and pasted into an R script to create a bespoke pipeline given the data available and the requirements of the analysis.
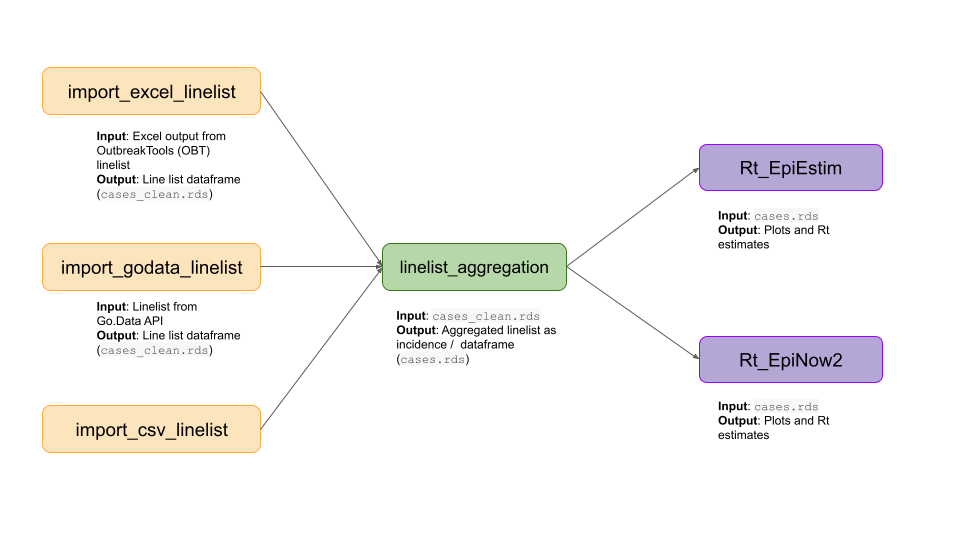
epipipe package vignettes that act as building block to create pipelines