Epiverse-TRACE showcase: {simulist}

Joshua W. Lambert

May 2025

Let’s take a step back

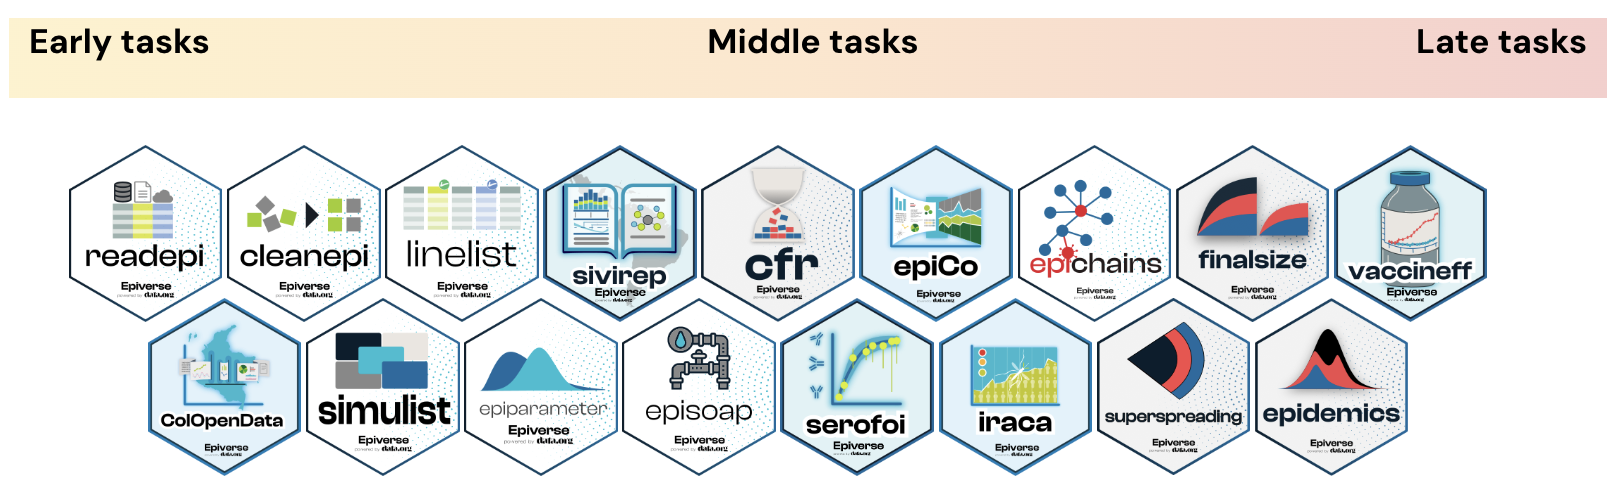
Epiverse-TRACE ecosystem of R packages
Aims of {simulist}

  • {simulist} is an R package for easily simulating individual-level outbreak data

    • Line list data
    • Contact tracing data
  • Epidemiologically realistic outbreak data

  • Highly customisable for users

  • Designed to be used primarily for teaching and methods testing

  • Interoperable with epi-ecosystem of R packages

  • Compliments {outbreaks}, which contains empirical outbreak datasets

Features

Simulation features

⏳ Parameterised epidemiological delay distributions

πŸ₯ Population-wide or age-stratified hospitalisation and death risks

πŸ“Š Uniform or age-structured populations

πŸ“ˆ Constant or time-varying case fatality risk

πŸ“‹ Customisable probability of case types and contact tracing follow-up

Postprocessing features

πŸ“… Real-time outbreak snapshots with right-truncation

πŸ“ Messy data with inconsistencies, mistakes and missing values

Simple package interface

Only 6 functions in the package:

Simulate

Post-process

Helper function

Model schematic slide

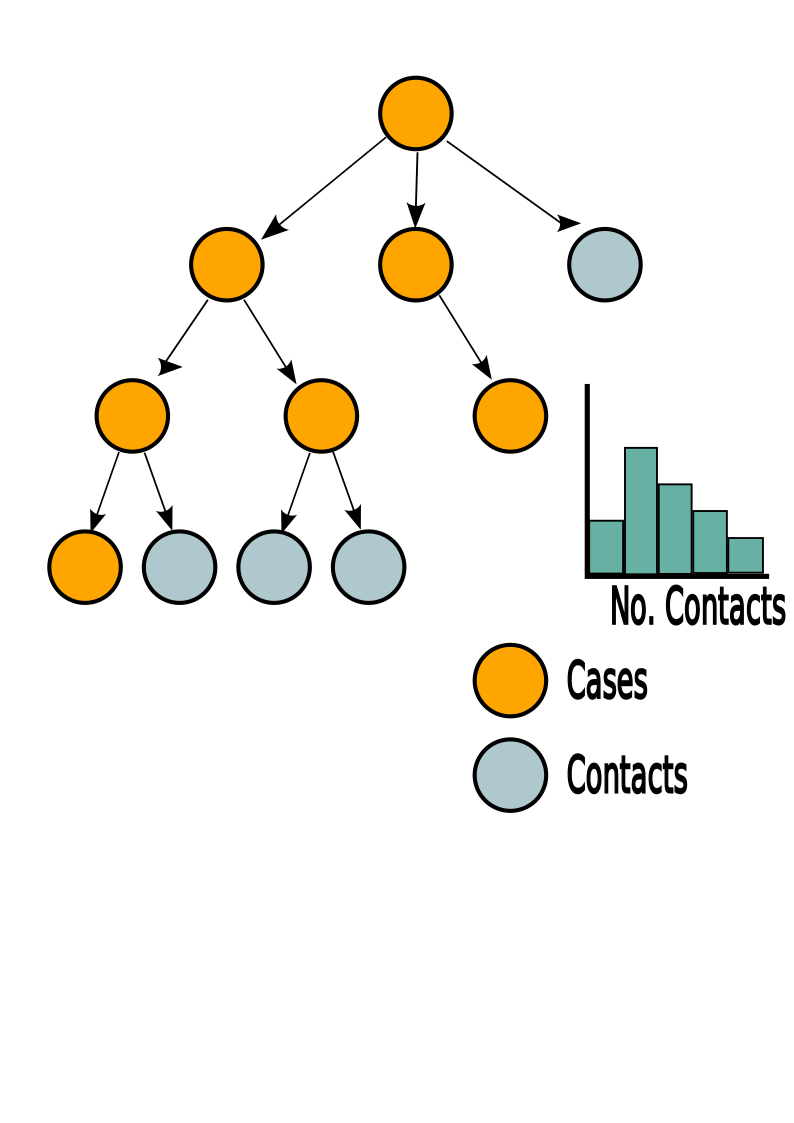
Network-adjusted contact distribution
Getting started

set.seed(1)
linelist <- simulist::sim_linelist()
knitr::kable(head(linelist, n = 4))
id case_name case_type sex age date_onset date_reporting date_admission outcome date_outcome date_first_contact date_last_contact ct_value
1 Lolette Phillips suspected f 59 2023-01-01 2023-01-01 2023-01-09 died 2023-01-13 NA NA NA
2 James Jack suspected m 90 2023-01-01 2023-01-01 NA recovered NA 2022-12-29 2023-01-03 NA
3 Chen Kantha confirmed m 4 2023-01-02 2023-01-02 NA recovered NA 2022-12-28 2023-01-01 24.8
5 Saleema al-Zaki probable f 29 2023-01-04 2023-01-04 NA recovered NA 2022-12-28 2023-01-04 NA

Getting started

set.seed(1)
linelist <- simulist::sim_contacts()
knitr::kable(head(linelist, n = 4))
from to age sex date_first_contact date_last_contact was_case status
Louis Baltazar-Francisco Masooma Sheldon 58 f 2022-12-27 2023-01-04 N under_followup
Louis Baltazar-Francisco Rachel Fredericks 29 f 2022-12-30 2023-01-06 Y case
Rachel Fredericks Makiah Thomas 24 f 2023-01-12 2023-01-18 Y case
Rachel Fredericks Mersadez Swift 42 f 2023-01-11 2023-01-18 N lost_to_followup

Demonstration

Custom epidemiological delay distributions


linelist <- sim_linelist(
  contact_distribution = function(x) dnbinom(x = x, mu = 2, size = 0.5),
  infectious_period = function(x) rgamma(n = x, shape = 2, scale = 2),
  prob_infection = 0.5,
  onset_to_hosp = function(x) rlnorm(n = x, meanlog = 1.5, sdlog = 0.5),
  onset_to_death = function(x) rweibull(n = x, shape = 1, scale = 5)
)

Controlling outbreak size

set.seed(1)
linelist <- simulist::sim_linelist(outbreak_size = c(100, 500))
nrow(linelist)
[1] 158


set.seed(12)
linelist <- simulist::sim_linelist(outbreak_size = c(100, 500))
Warning: Number of cases exceeds maximum outbreak size. 
Returning data early with 534 cases and 1006 total contacts (including cases).
nrow(linelist)
[1] 534


  • First element of outbreak_size is a hard lower bound. Second element of outbreak_size is a soft upper bound.

Anonymous line list

set.seed(1)
linelist <- simulist::sim_linelist(anonymise = FALSE)
knitr::kable(head(linelist[, c("id", "case_name")]))
id case_name
1 Lolette Phillips
2 James Jack
3 Chen Kantha
5 Saleema al-Zaki
6 David Ponzio
7 Christopher Ward
set.seed(1)
linelist <- simulist::sim_linelist(anonymise = TRUE)
knitr::kable(head(linelist[, c("id", "case_name")]))
id case_name
1 OmCDs9Gqoq
2 2caGYwf3Vp
3 r9ygHlNgE8
5 31KytmAD16
6 p4rEcp8O9s
7 4Rz5nck3Cl

Case type

set.seed(1)
linelist <- simulist::sim_linelist()
knitr::kable(head(linelist[, c("id", "case_type")]))
id case_type
1 suspected
2 suspected
3 confirmed
5 probable
6 confirmed
7 probable
set.seed(1)
linelist <- simulist::sim_linelist(
  case_type_probs = c(suspected = 0.05, probable = 0.05, confirmed = 0.9)
)
knitr::kable(head(linelist[, c("id", "case_type")]))
id case_type
1 confirmed
2 confirmed
3 confirmed
5 confirmed
6 confirmed
7 confirmed

Outbreak snapshot with truncation

set.seed(2)
linelist <- simulist::sim_linelist(
  reporting_delay = function(x) rlnorm(n = x, meanlog = 1, sdlog = 1)
)
knitr::kable(head(linelist[, 1:7], n = 3))
id case_name case_type sex age date_onset date_reporting
1 Dallas Coblentz confirmed f 13 2023-01-01 2023-01-05
3 Adam Perez suspected m 26 2023-01-13 2023-01-14
4 Rebecca Brown confirmed f 58 2023-01-18 2023-01-28

Aggregate and plot outbreak with {incidence2}
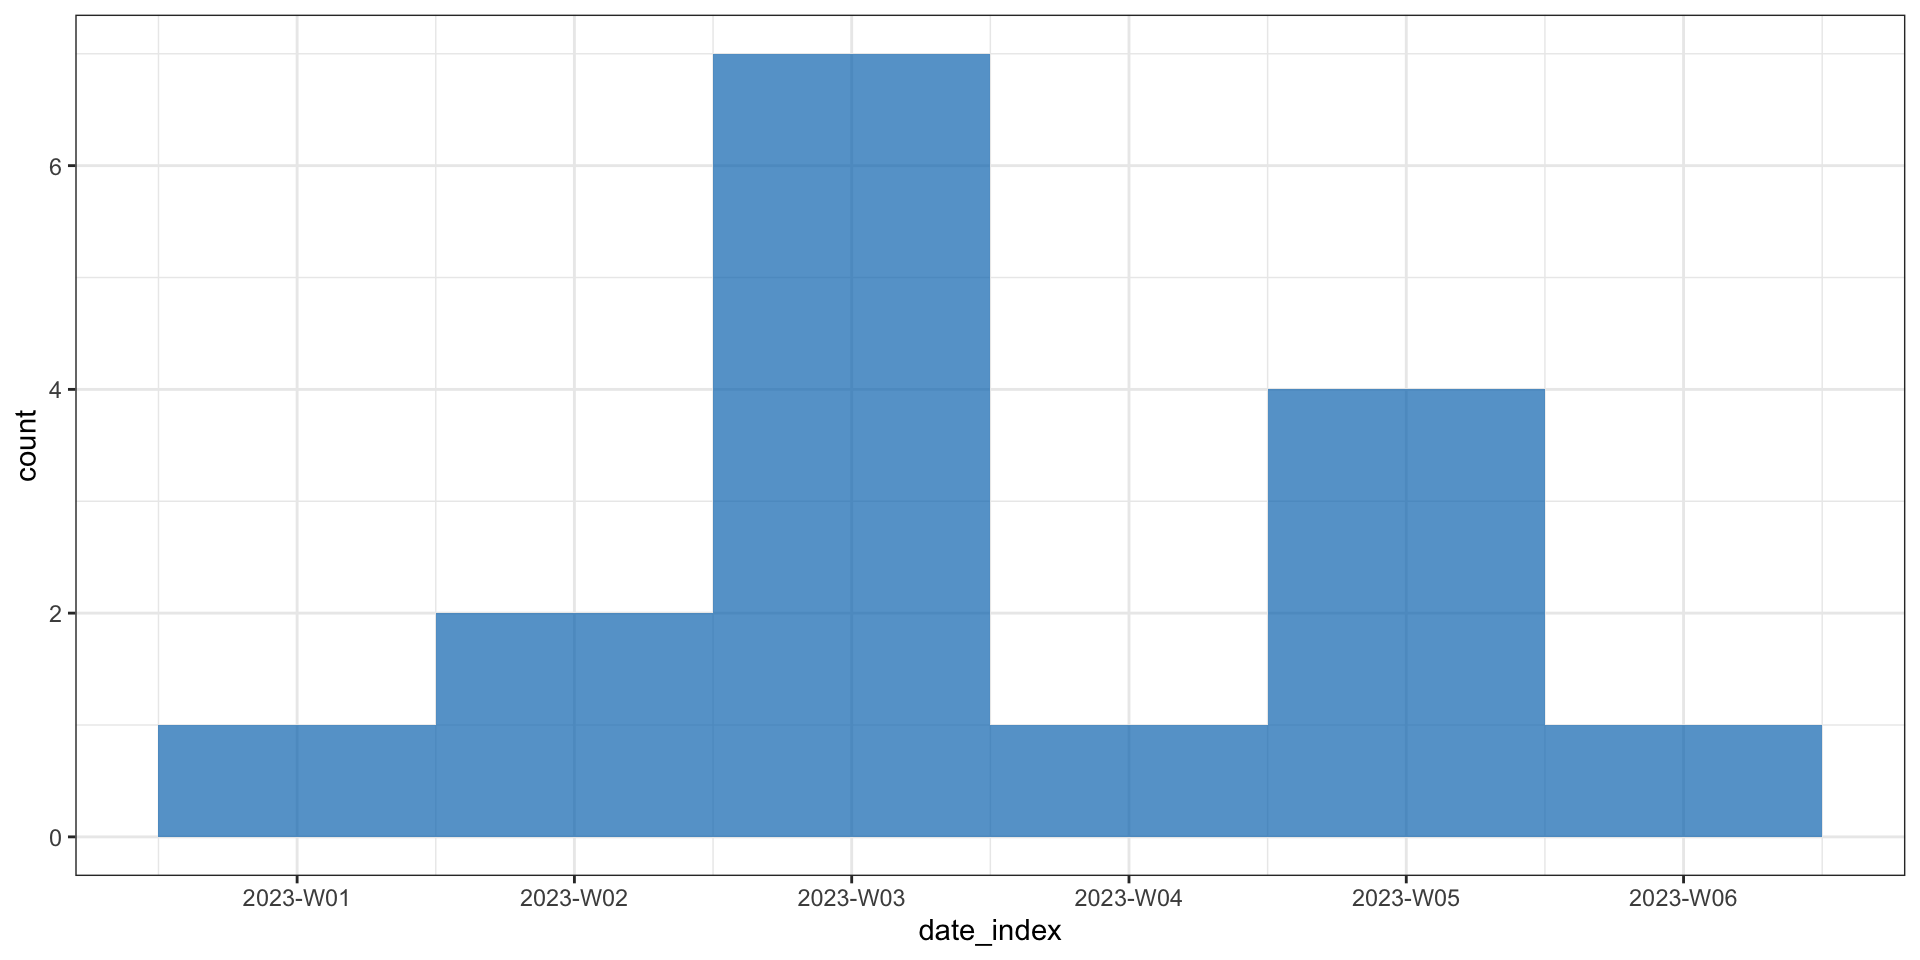
Outbreak snapshot with truncation
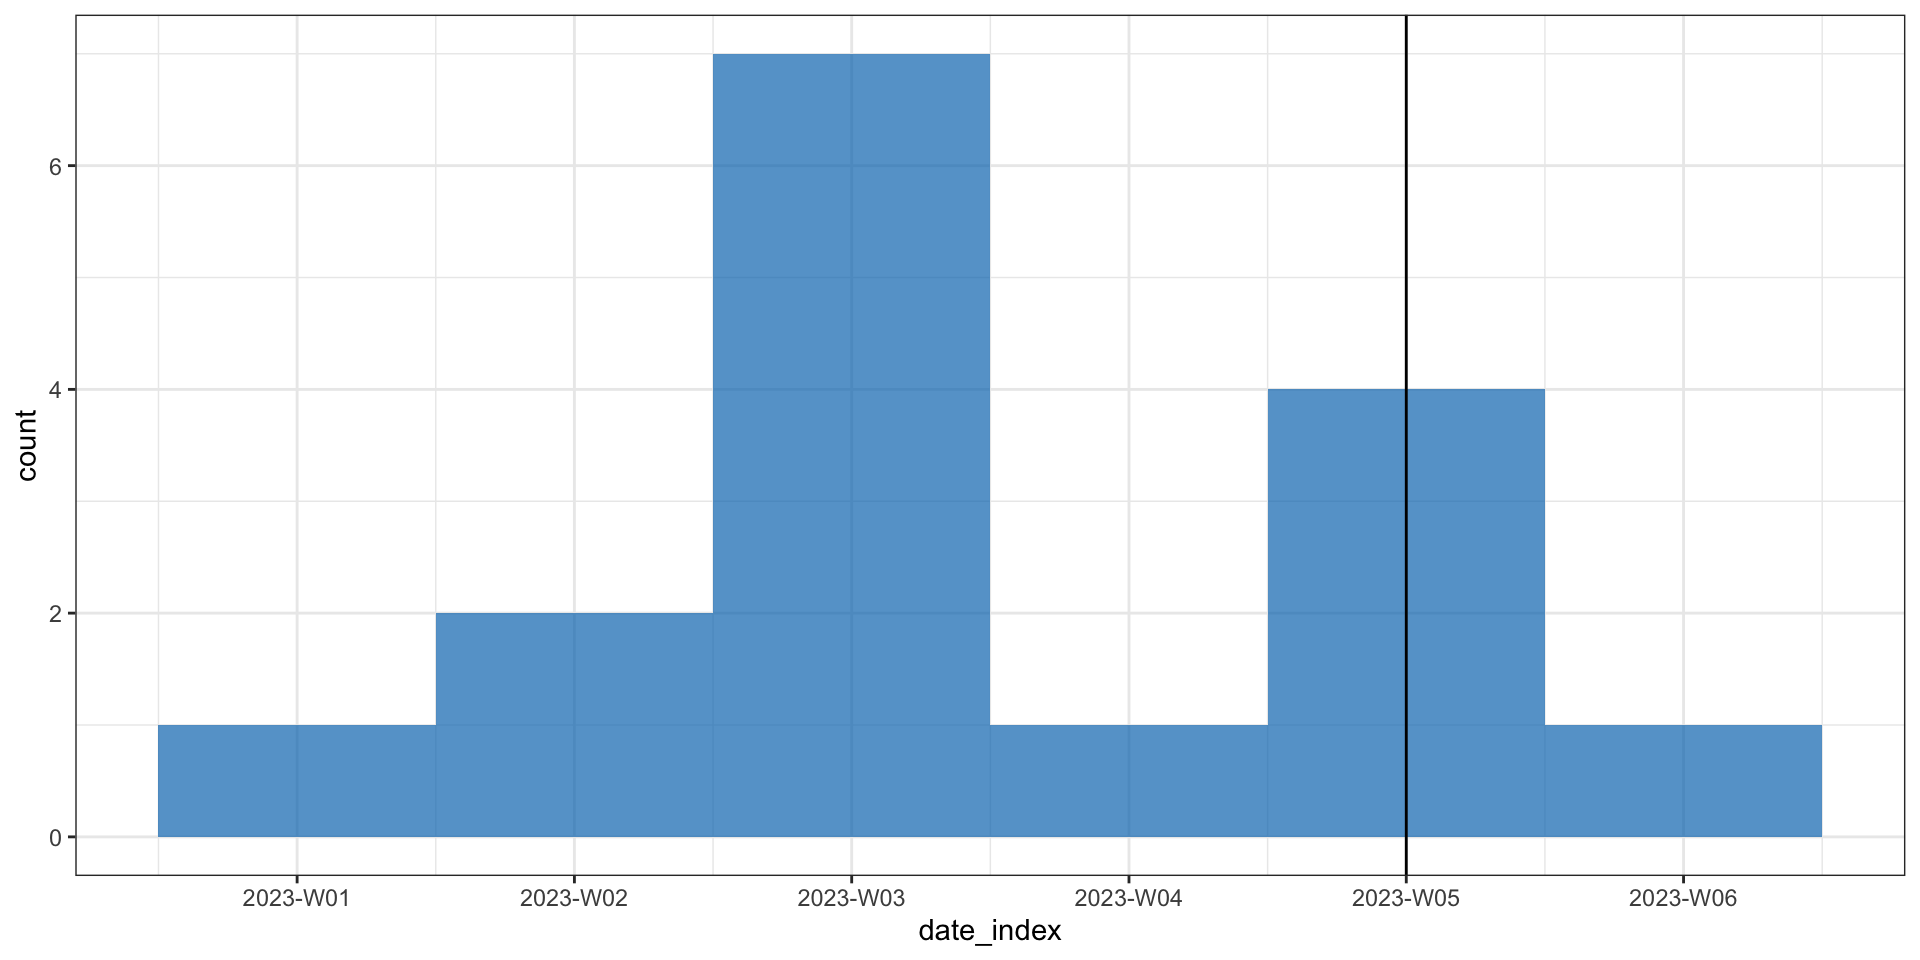
Outbreak snapshot with truncation
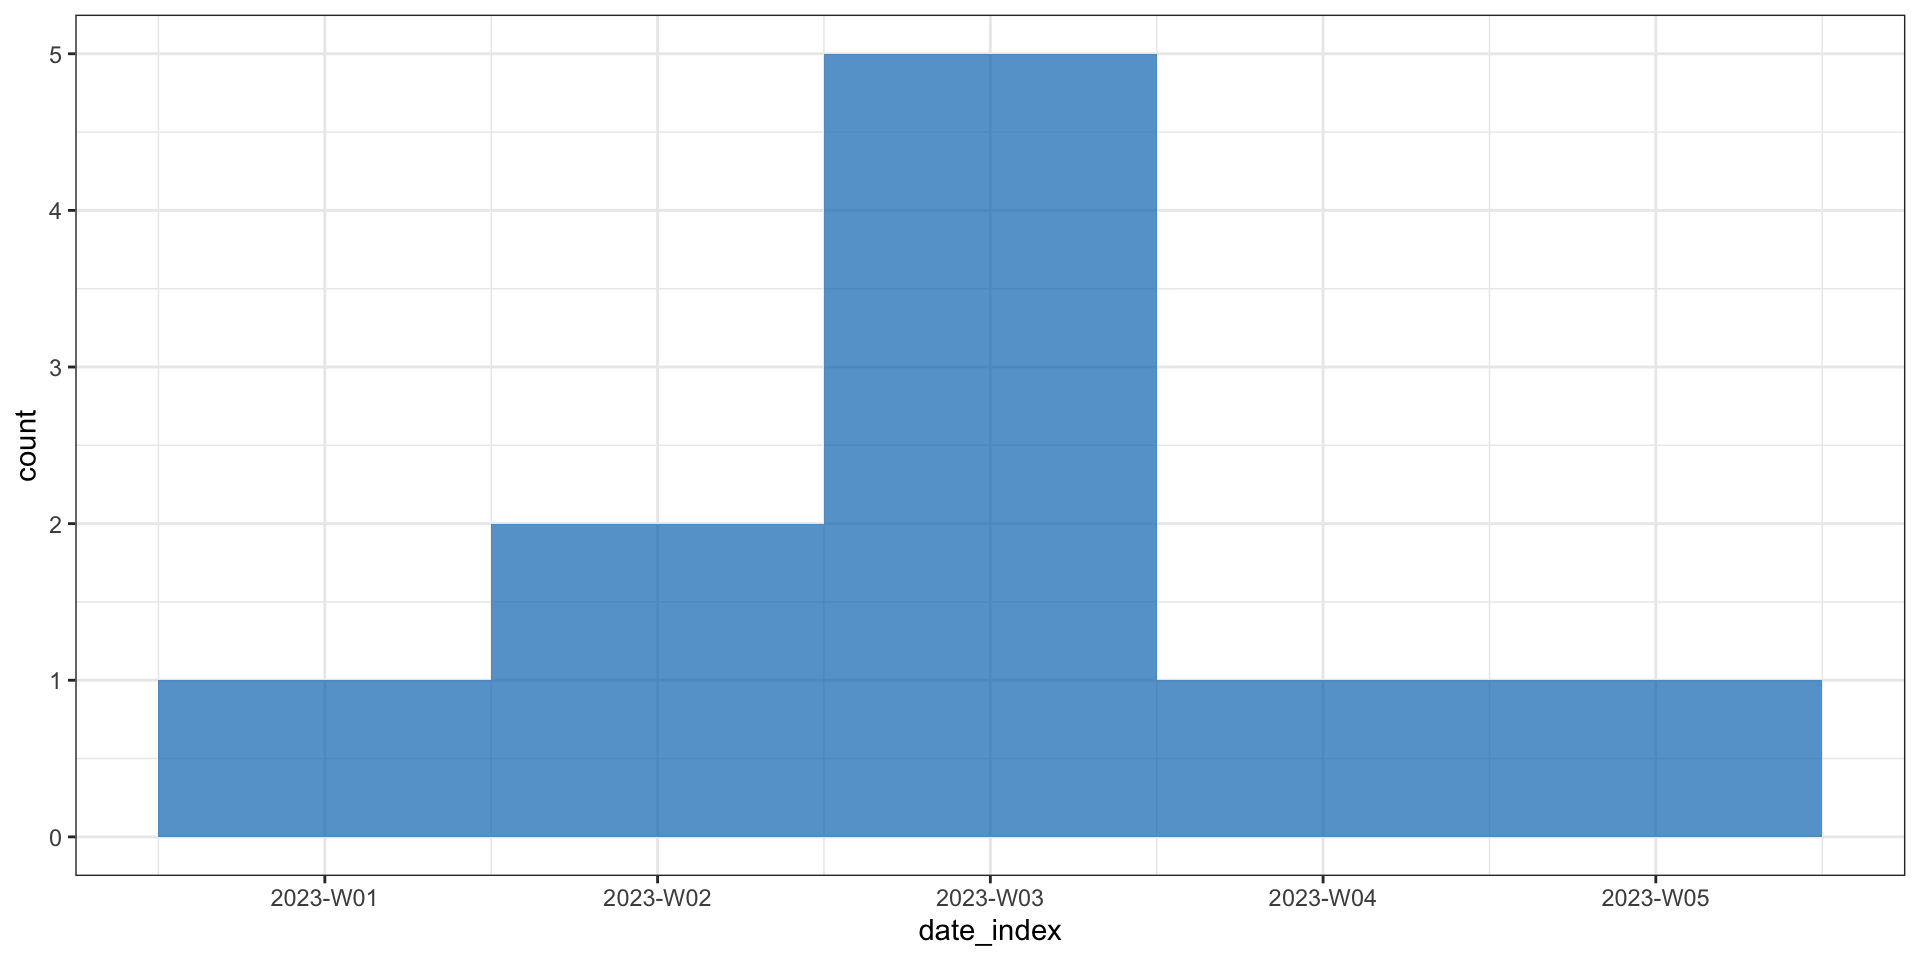
trunc_linelist <- simulist::truncate_linelist(
  linelist = linelist, 
  truncation_day = as.Date("2023-02-01")
)
knitr::kable(head(trunc_linelist, n = 4))
id case_name case_type sex age date_onset date_reporting date_admission outcome date_outcome date_first_contact date_last_contact ct_value
1 Dallas Coblentz confirmed f 13 2023-01-01 2023-01-05 NA recovered NA NA NA 23.0
3 Adam Perez suspected m 26 2023-01-13 2023-01-14 NA recovered NA 2022-12-30 2023-01-03 NA
4 Rebecca Brown confirmed f 58 2023-01-18 2023-01-28 2023-01-21 recovered NA 2023-01-08 2023-01-18 23.9
5 Michal Brooks probable f 11 2023-01-18 2023-01-24 NA recovered NA 2023-01-11 2023-01-16 NA

Outbreak snapshot with truncation

Advanced features


Interoperability

{simulist} and complimentary R packages


πŸ“¦ β†”οΈŽοΈ πŸ“¦ {epiparameter}


πŸ“¦ β†”οΈŽοΈ πŸ“¦ {epicontacts}


πŸ“¦ β†”οΈŽοΈ πŸ“¦ {incidence2}


πŸ“¦ β†”οΈŽοΈ πŸ“¦ {cleanepi}

{simulist} & {epiparameter}

library(epiparameter)
# create <epiparameter> for infectious period
infectious_period <- epiparameter(
  disease = "COVID-19",
  epi_name = "infectious period",
  prob_distribution = create_prob_distribution(
    prob_distribution = "gamma",
    prob_distribution_params = c(shape = 1, scale = 1)
  )
)

# get onset to death from {epiparameter} database
onset_to_death <- epiparameter_db(
  disease = "COVID-19",
  epi_name = "onset to death",
  single_epiparameter = TRUE
)

linelist <- simulist::sim_linelist(
  infectious_period = infectious_period,
  onset_to_death = onset_to_death
)

{simulist} & {incidence2}

library(incidence2)
set.seed(1)
linelist <- simulist::sim_linelist()
daily <- incidence(
  x = linelist,
  date_index = "date_onset",
  interval = "daily",
  complete_dates = TRUE
)
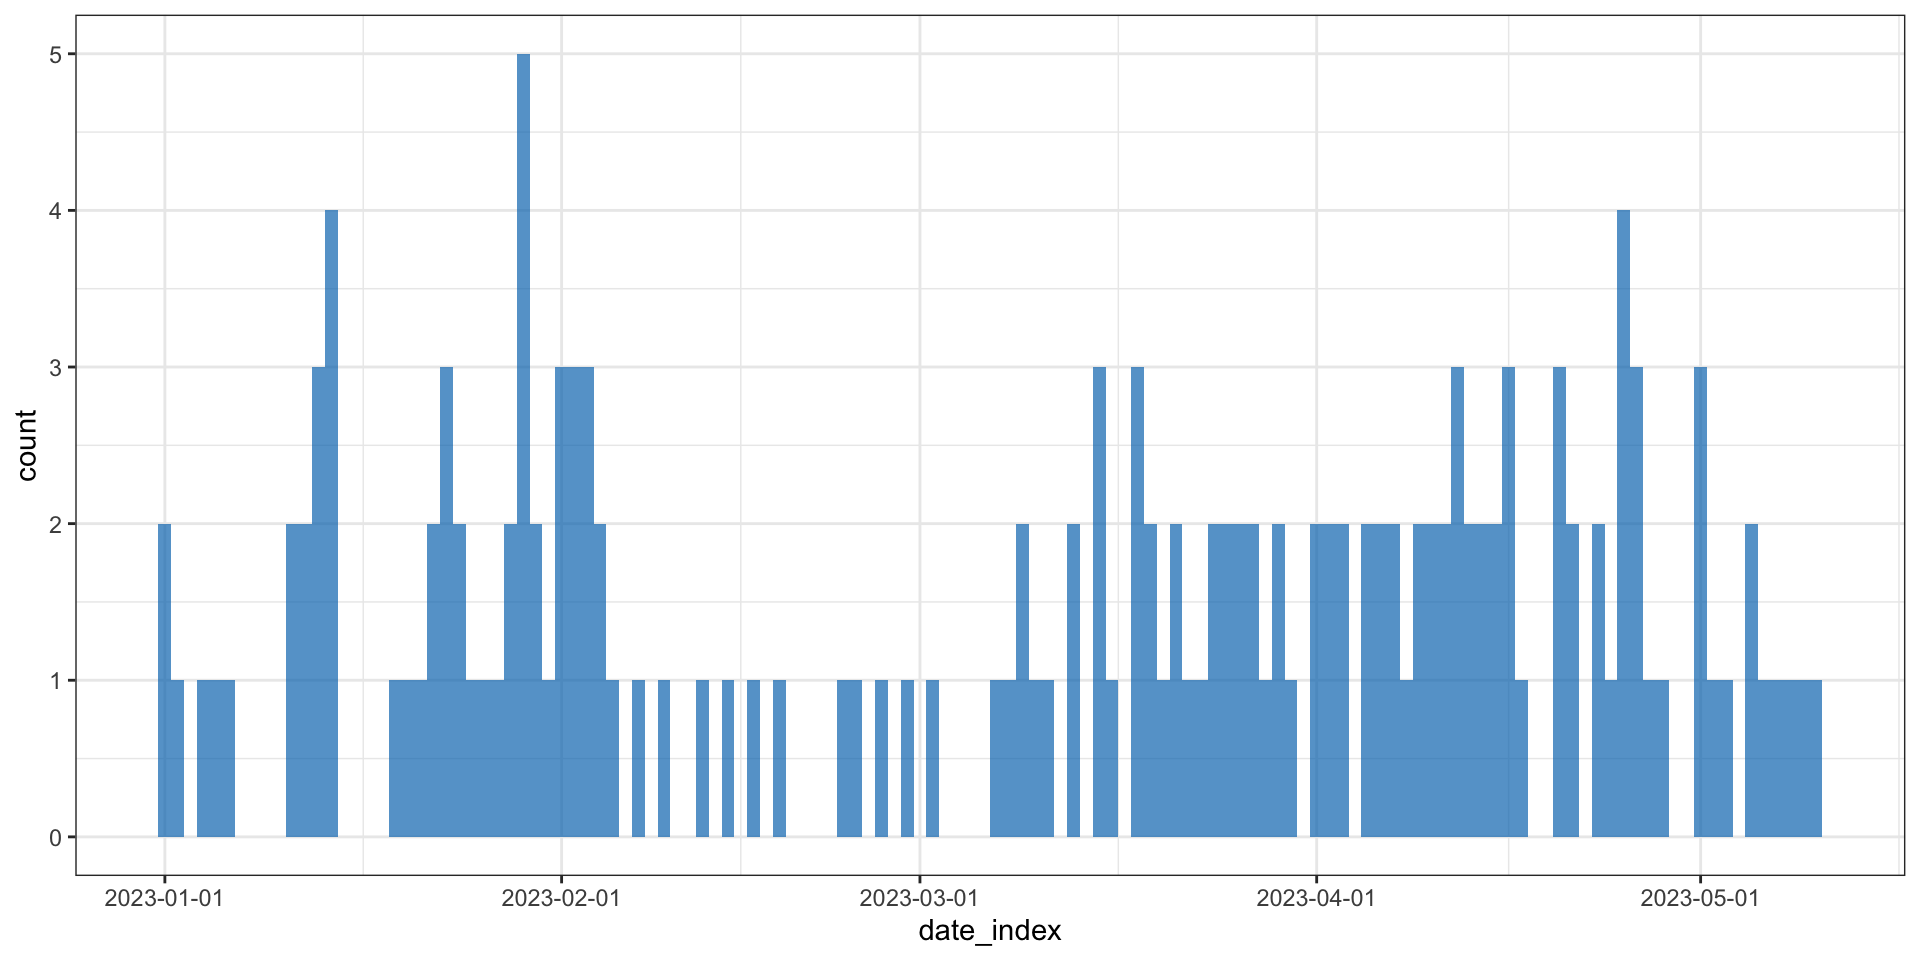
plot(daily)

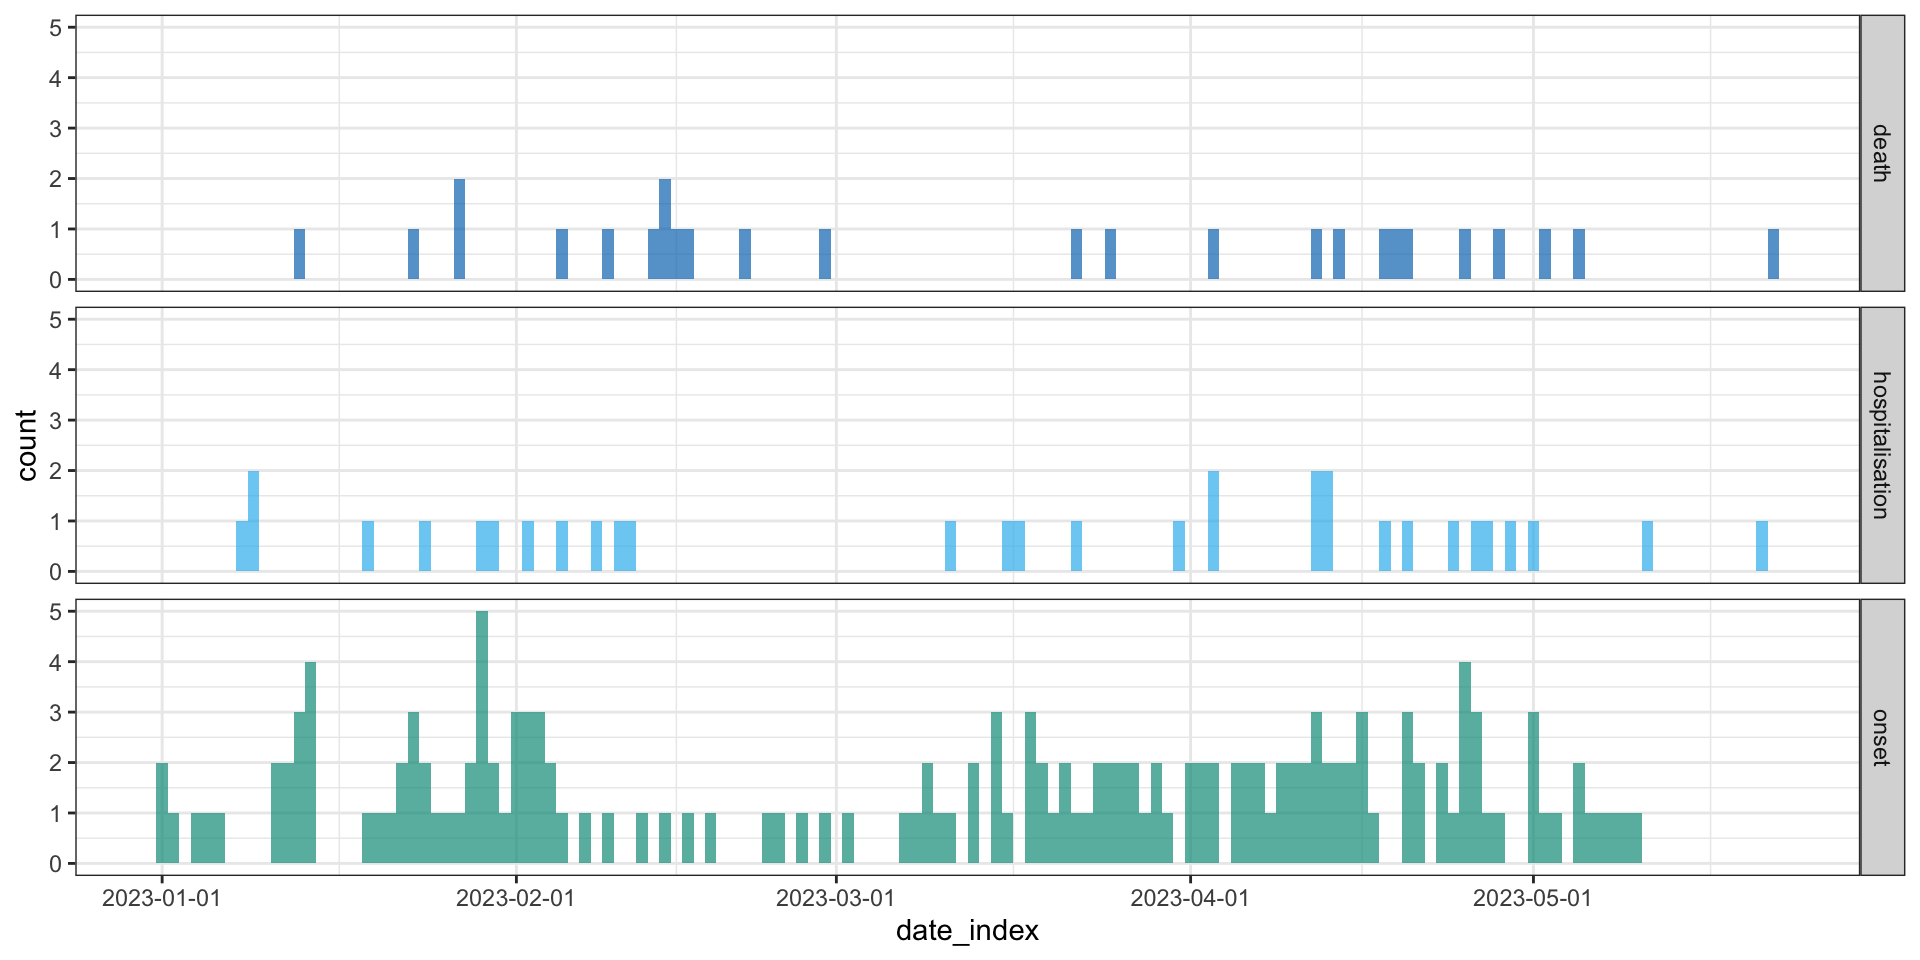
{simulist} & {incidence2}

Show the code
library(incidence2)
library(tidyr)
library(dplyr)
set.seed(1)
linelist <- simulist::sim_linelist()

linelist <- linelist %>%
  tidyr::pivot_wider(
    names_from = outcome,
    values_from = date_outcome
  ) %>%
  dplyr::rename(
    date_death = died,
    date_recovery = recovered
  )

daily <- incidence(
  linelist,
  date_index = c(
    onset = "date_onset",
    hospitalisation = "date_admission",
    death = "date_death"
  ),
  interval = "daily",
  complete_dates = TRUE
)
plot(daily)
{simulist} & {epicontacts}

library(epicontacts)
set.seed(2)
outbreak <- simulist::sim_outbreak()
epicontacts <- make_epicontacts(
  linelist = outbreak$linelist,
  contacts = outbreak$contacts,
  id = "case_name",
  from = "from",
  to = "to",
  directed = TRUE
)
plot(epicontacts)

{simulist} & {cleanepi}

Create a messy linelist

set.seed(1)
linelist <- simulist::sim_linelist()
messy_linelist <- simulist::messy_linelist(linelist)
knitr::kable(head(messy_linelist, n = 4))
id case_name case_type sex age date_onset date_reporting date_admission outcome date_outcome date_first_contact date_last_contact ct_value
1 Lolette Phillips suspected f 59 NA 2023-01-01 2023-01-09 died 2023-01-13 NA NA NA
two James Jack suspected Male 90 2023-01-01 2023-01-01 NA recovered NA NA 2023-01-03 NA
NA Chen Kantha NA M NA 2023-01-02 2023-01-02 NA recovered NA 2022-12-28 2023-01-01 24.8

{simulist} & {cleanepi}

clean_linelist <- messy_linelist |> 
  cleanepi::convert_to_numeric(target_columns = c("id", "age")) |>
  cleanepi::remove_duplicates()
knitr::kable(head(clean_linelist, n = 5))
id case_name case_type sex age date_onset date_reporting date_admission outcome date_outcome date_first_contact date_last_contact ct_value row_id
1 Lolette Phillips suspected f 59 NA 2023-01-01 2023-01-09 died 2023-01-13 NA NA NA 1
2 James Jack suspected Male 90 2023-01-01 2023-01-01 NA recovered NA NA 2023-01-03 NA 2
NA Chen Kantha NA M NA 2023-01-02 2023-01-02 NA recovered NA 2022-12-28 2023-01-01 24.8 4
5 NA probable F 29 2023-01-04 NA NA recovered NA 2022-12-28 2023-01-04 NA 5
6 NA confirmed myle 14 2023-01-05 2023-01-05 2023-01-09 died 2023-01-23 NA NA 24.6 6

{simulist} & {cleanepi}


More on this in Karim’s talk

Thank you for listening

Any questions?